Report
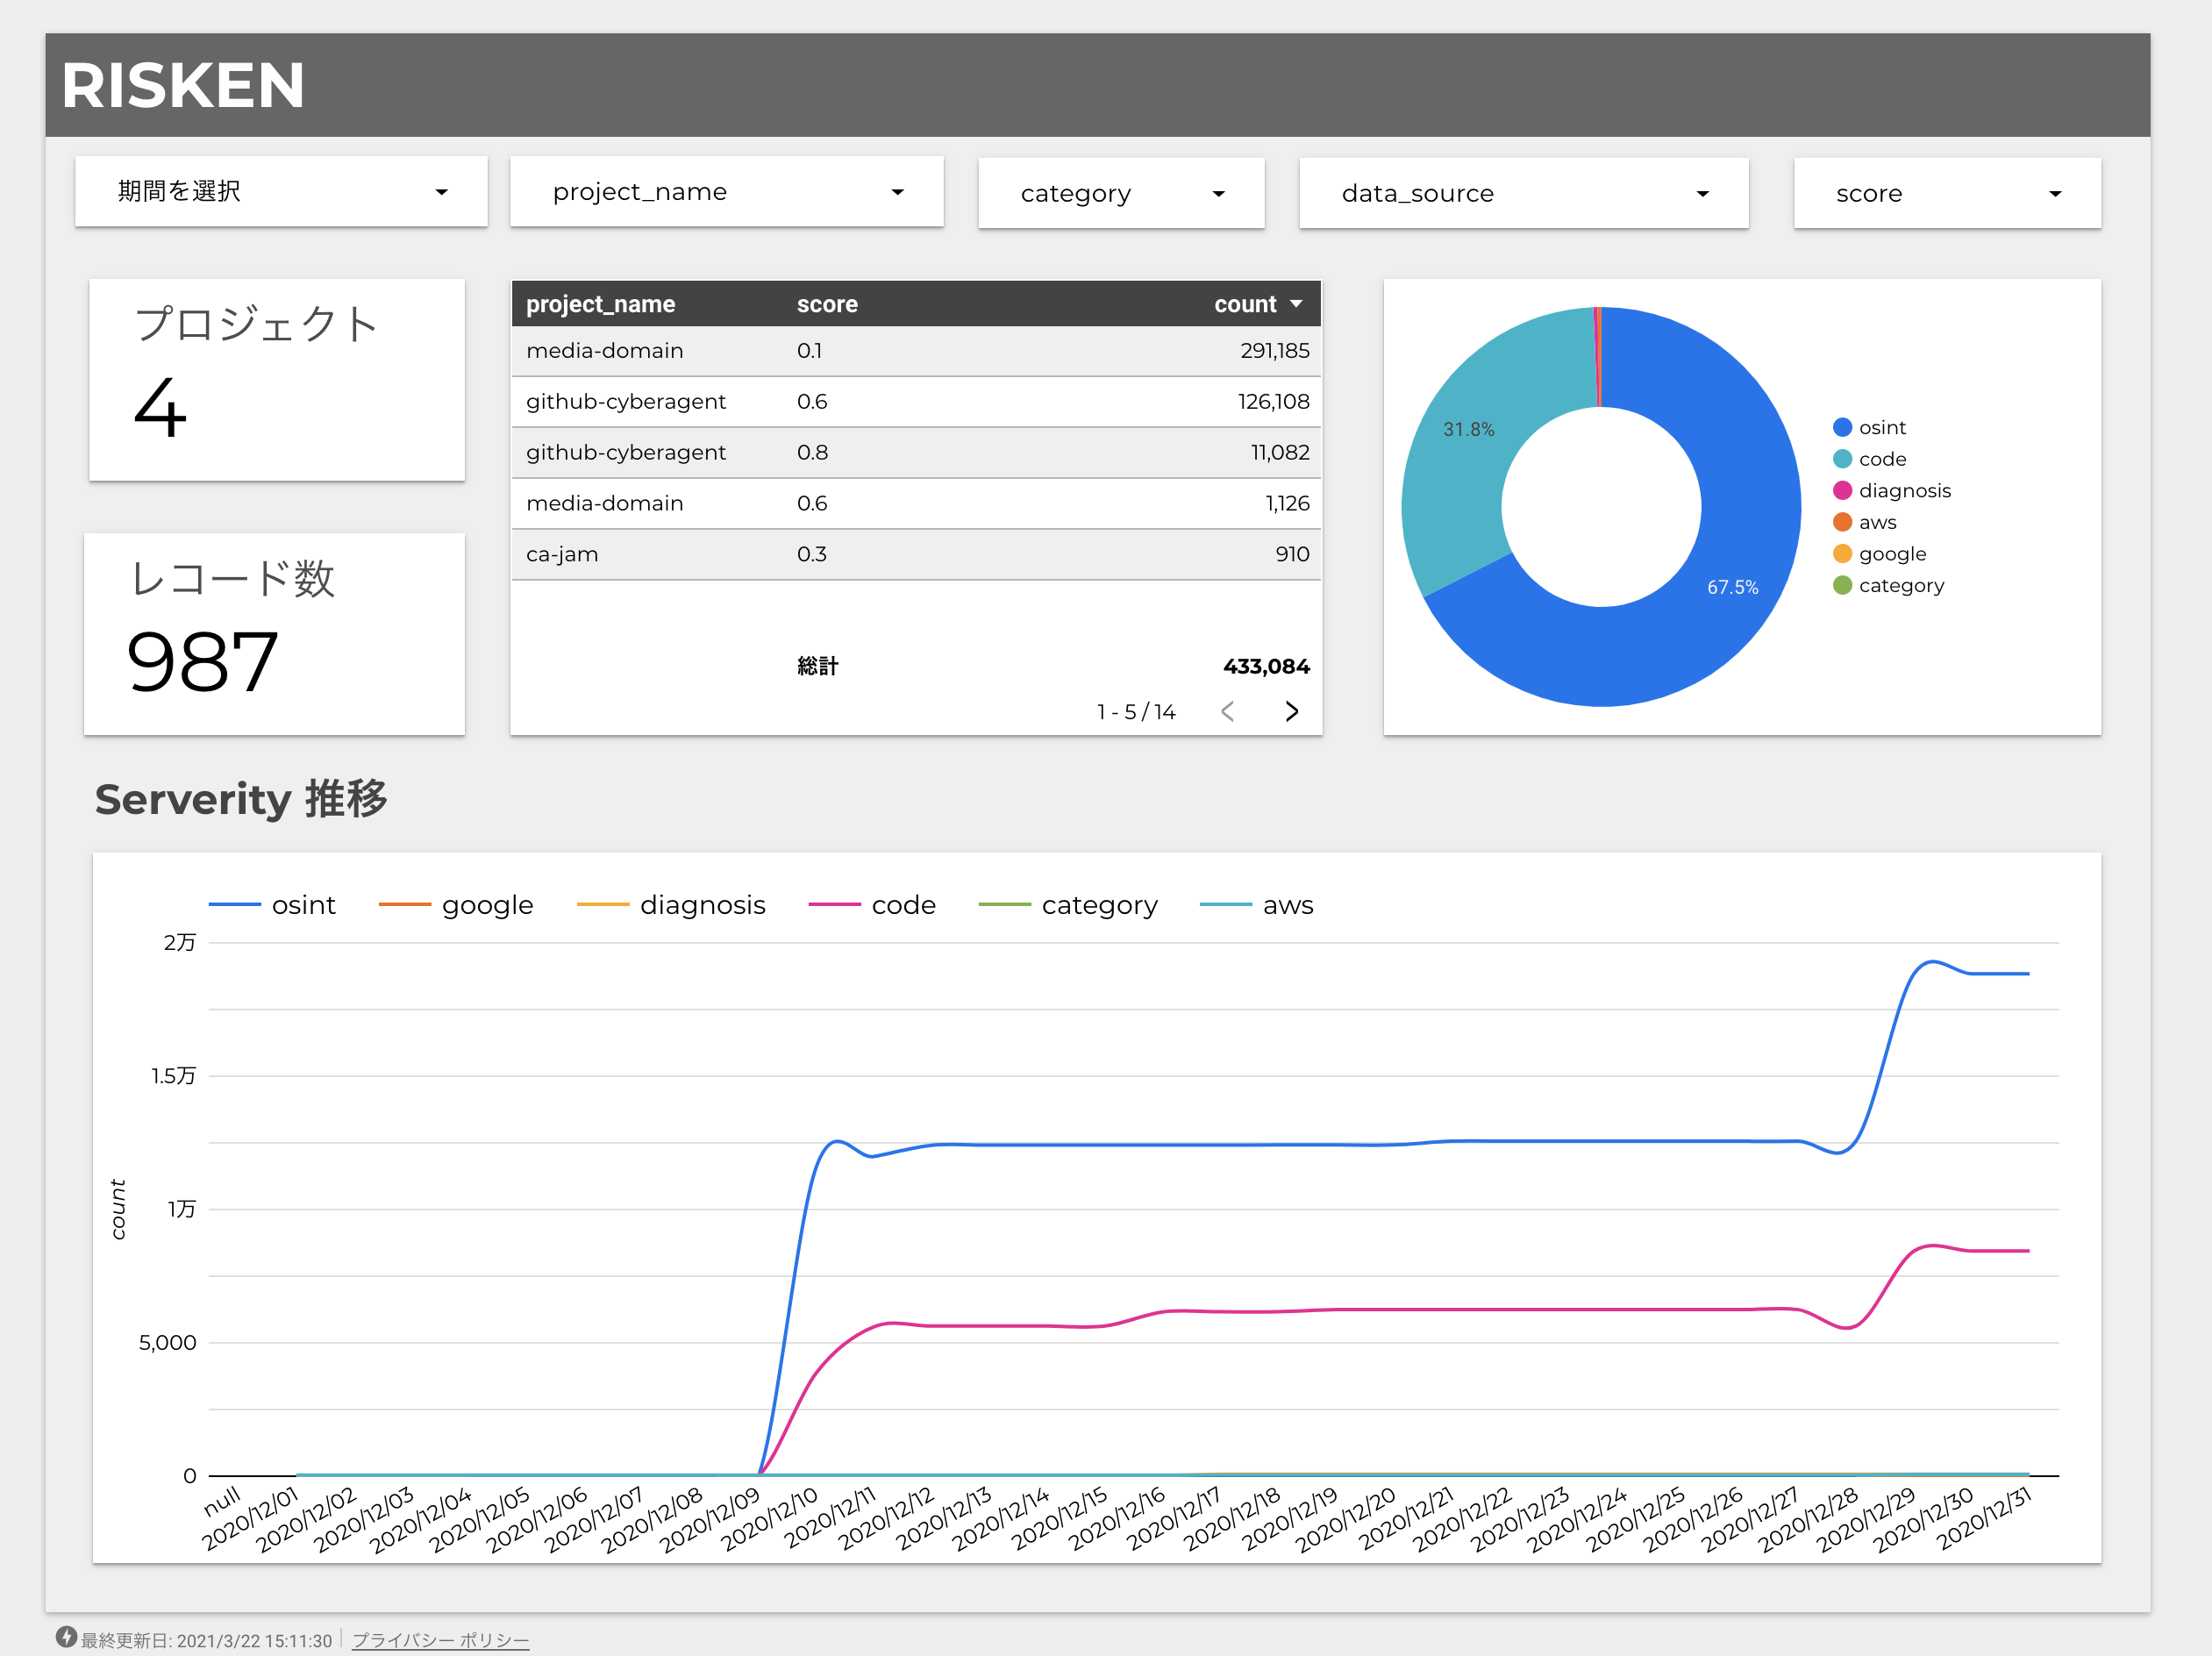
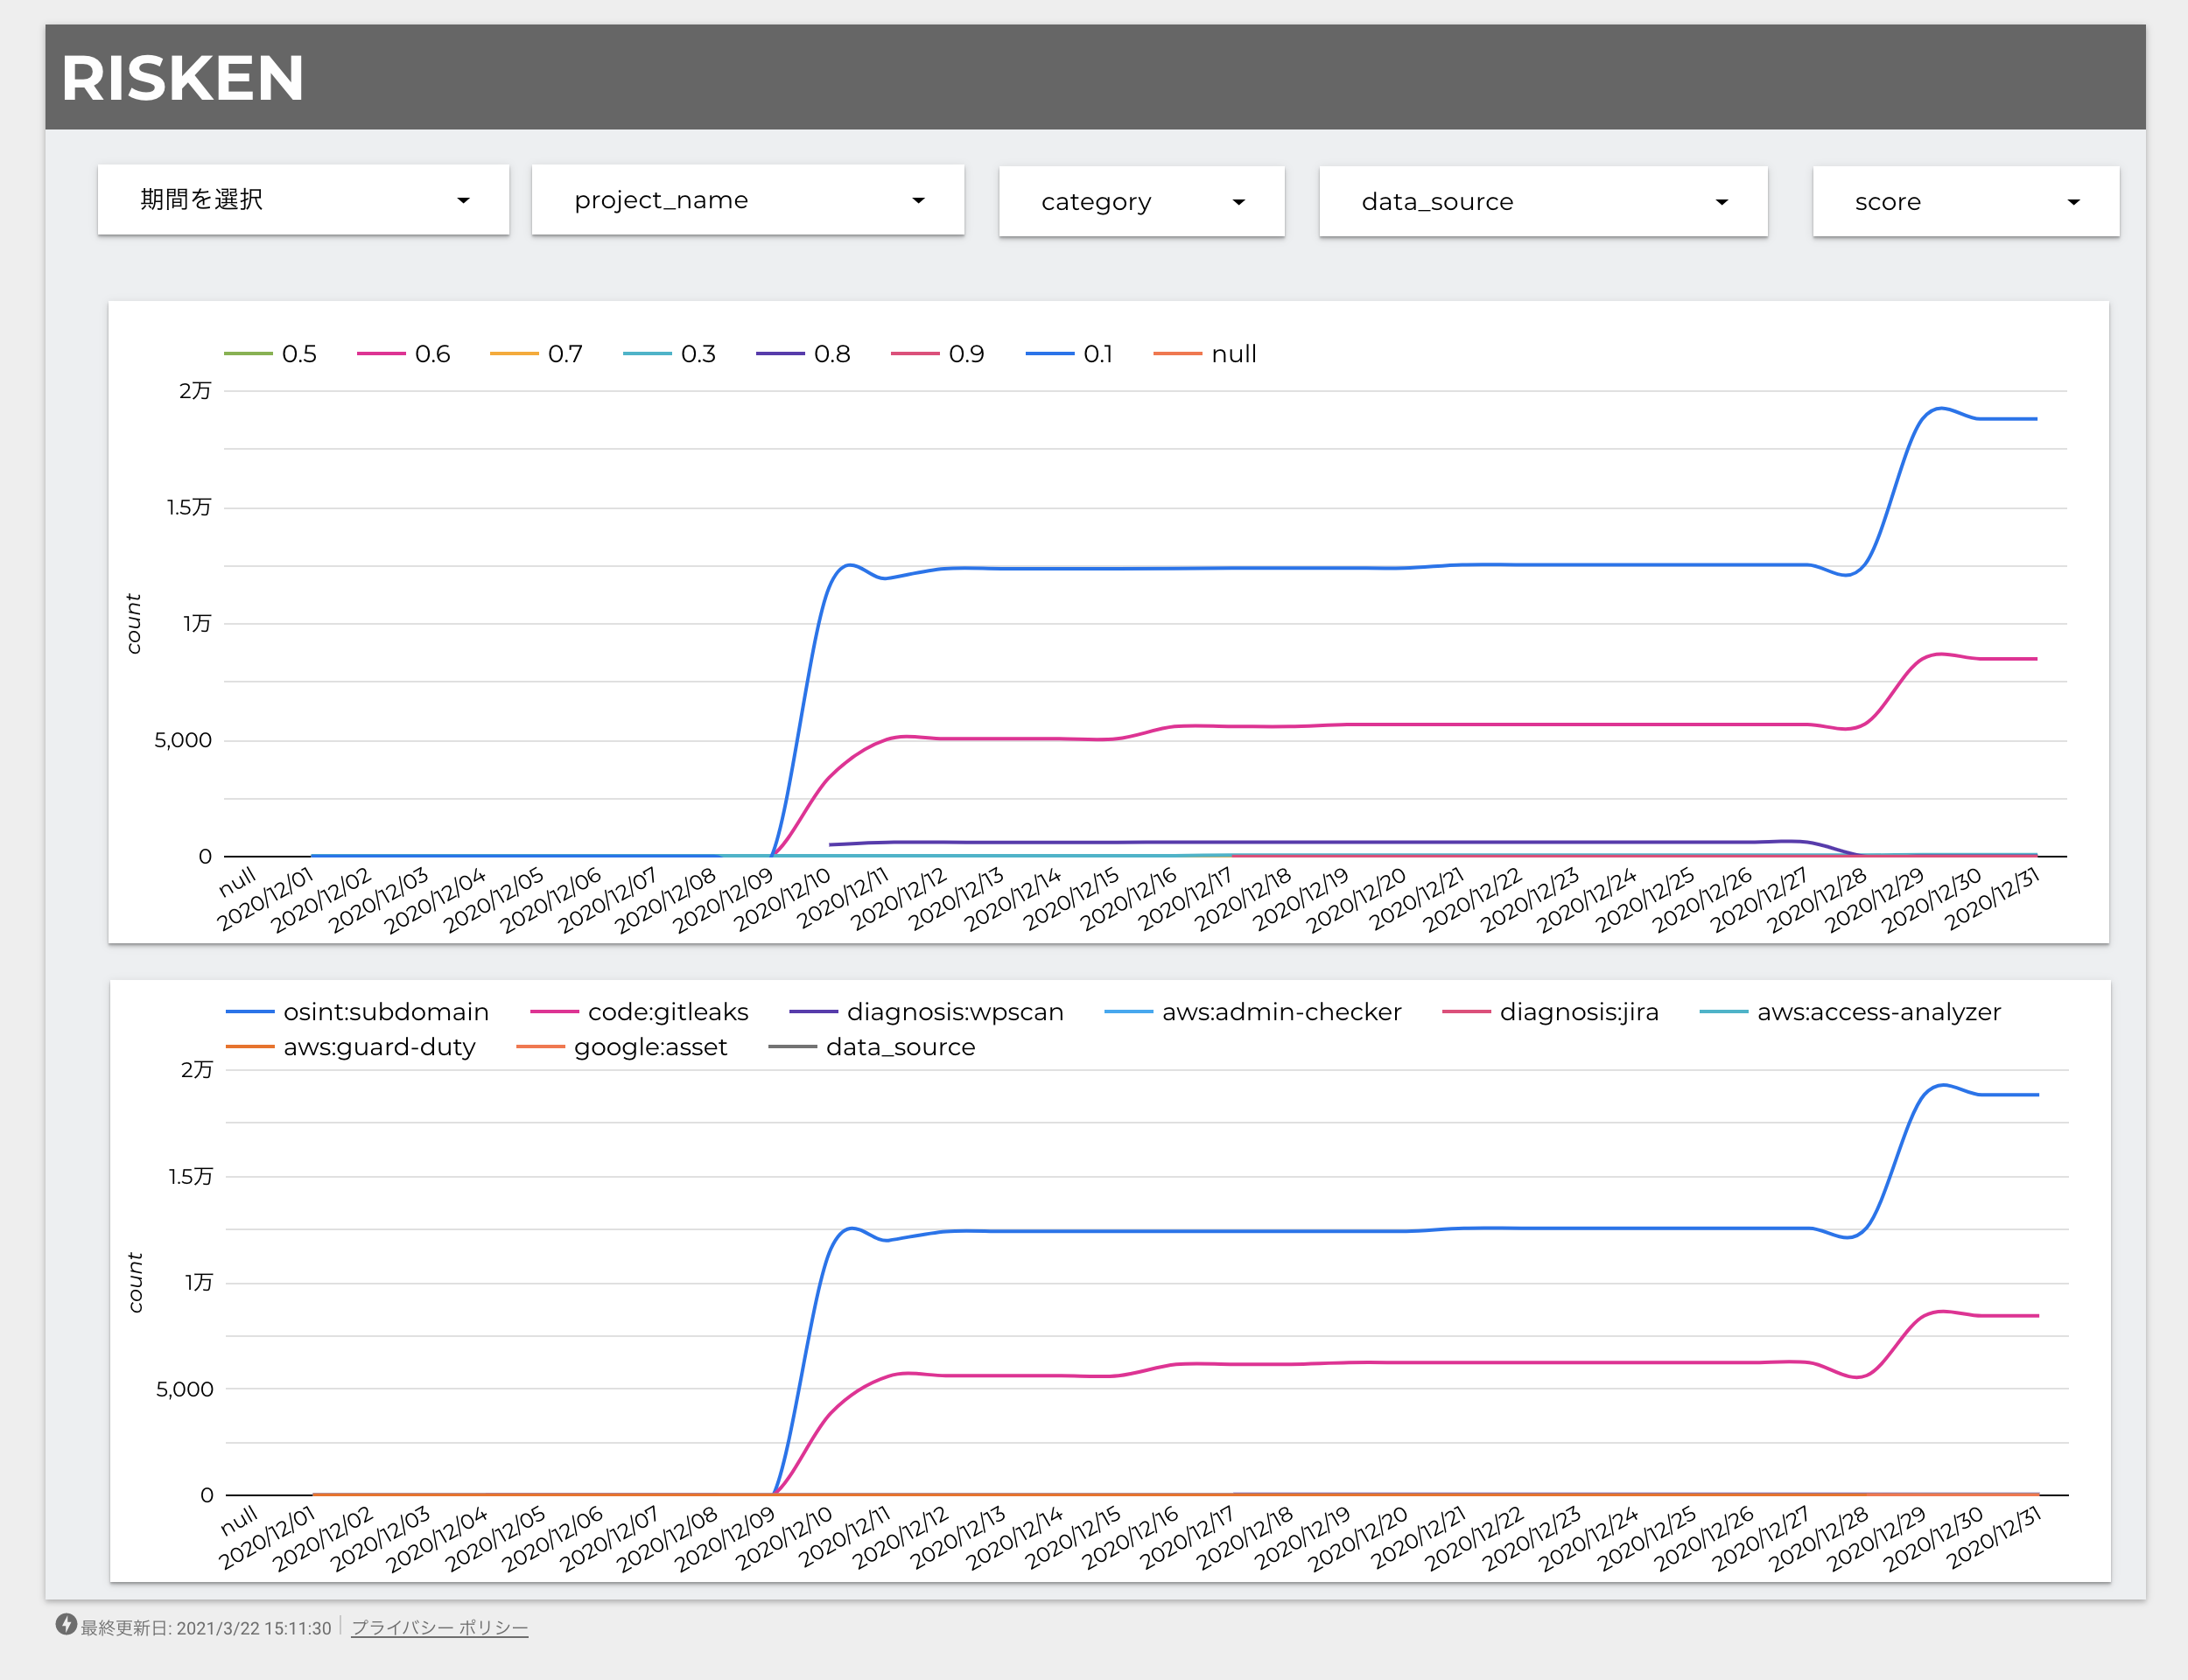
You can report how the data collected by RISKEN changes day by day.
- You can report the total number of issues or score changes over time.
- You can compare where and how many problems exist or do not exist, or how they differ from other projects.
- This also visualizes the achievements of on-site developers or security personnel.
Note
Maintaining security in an environment where development is constantly changing requires a great deal of effort. Visualization is also important in that respect.
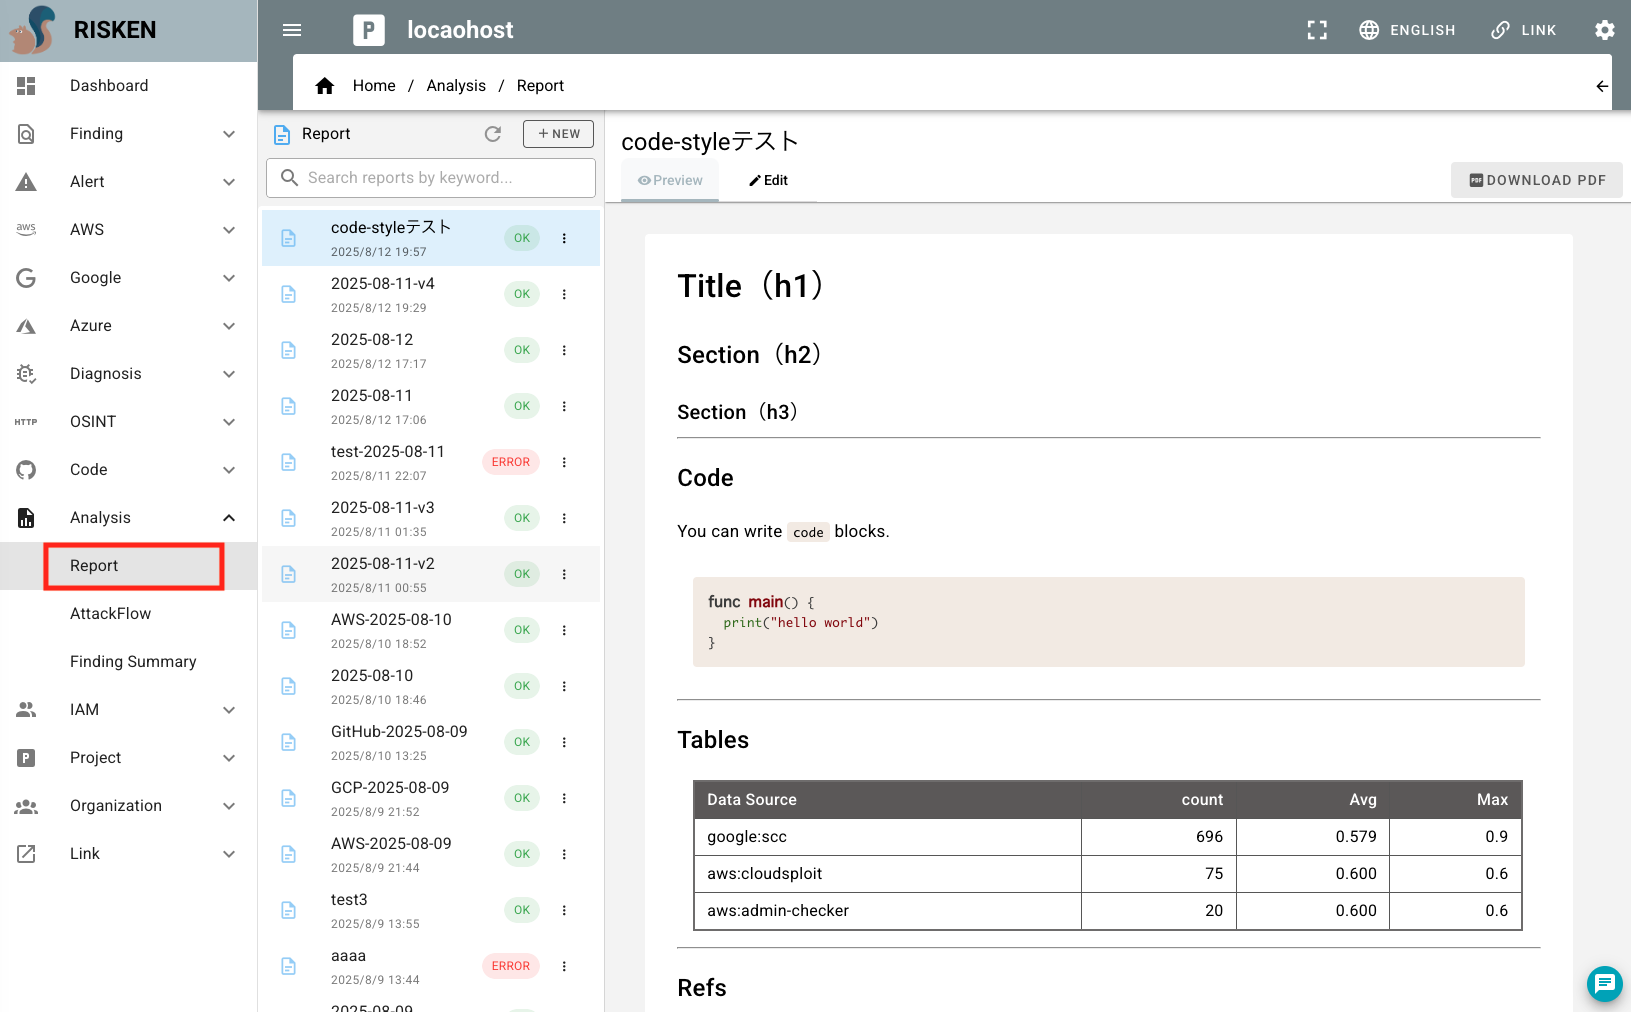
Report
The Analysis > Report screen allows you to create project reports.
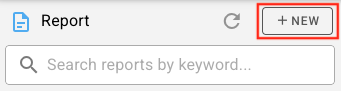
AI-powered Automatic Report Generation
- Navigate to the
Analysis > Reportscreen - Click the
NEWbutton at the top of the list
- In the dialog, enter the following items:
- Name: Name of the report
- DataSource: Select the data source for the report
- Base Score: Set the base score
- Prompt: Enter a prompt to generate the report content
- After entering the information, click the
CREATE AUTObutton
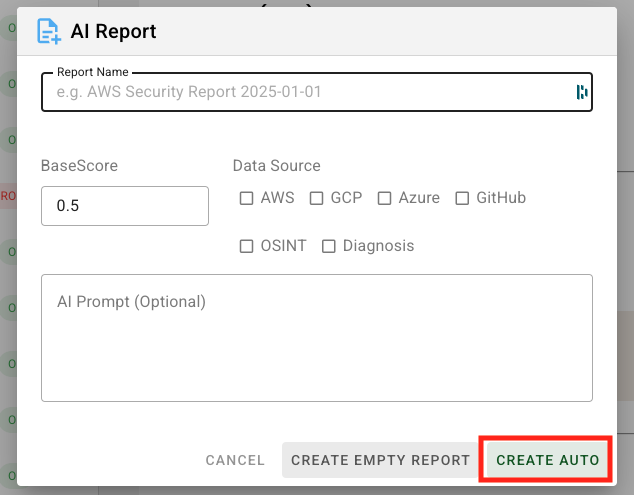
- To create a report manually instead of using AI generation, click the
CREATE EMPTY REPORTbutton
Editing Reports
- Navigate to the
Analysis > Reportscreen - Select the target report
- Choose the
Edittab from the right panel or click the>button
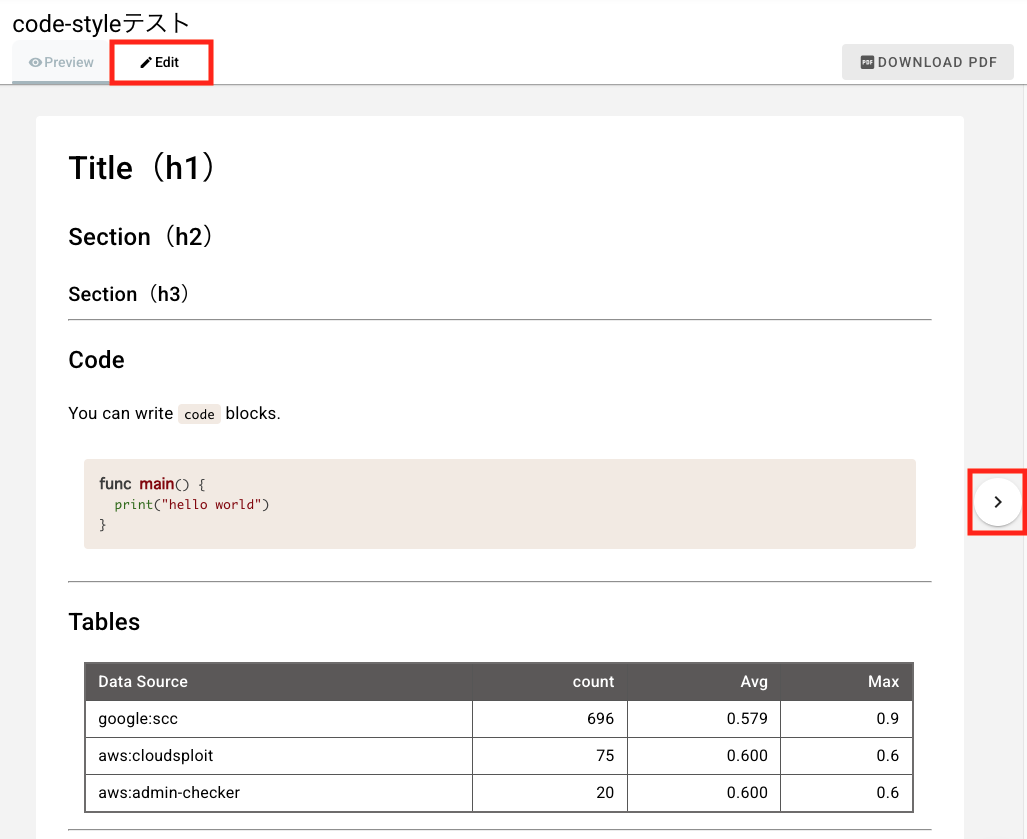
- Edit the report content
- After editing, click the
SAVEbutton
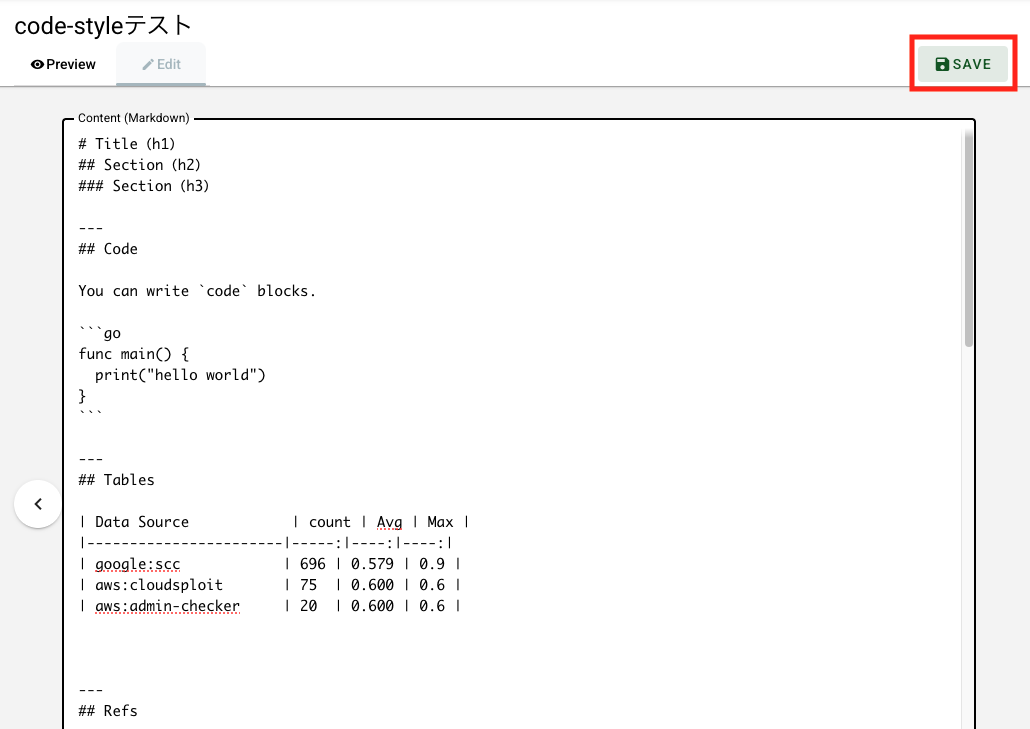
- You can switch between preview and edit modes using the
<and>buttons while editing
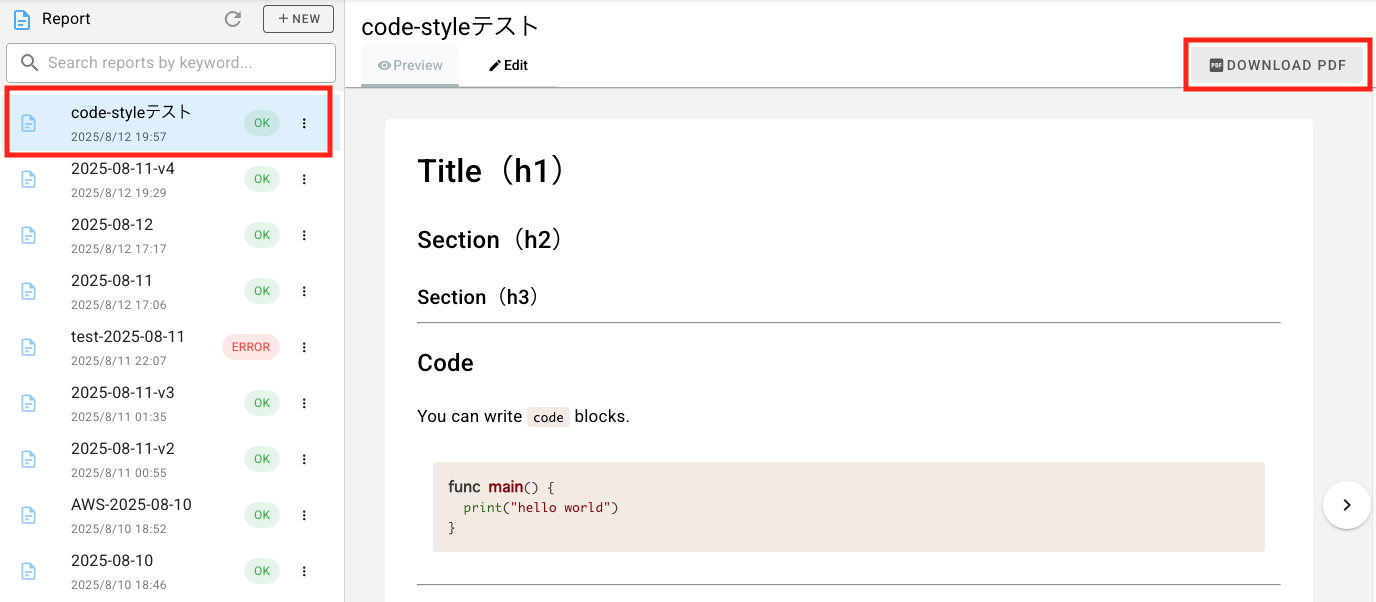
Downloading PDF
- Navigate to the
Analysis > Reportscreen - Select the target report
- Click the
DOWNLOAD PDFbutton from the right panel
Finding Summary
On the Analysis > Finding Summary screen, you can display/download statistical data for findings.
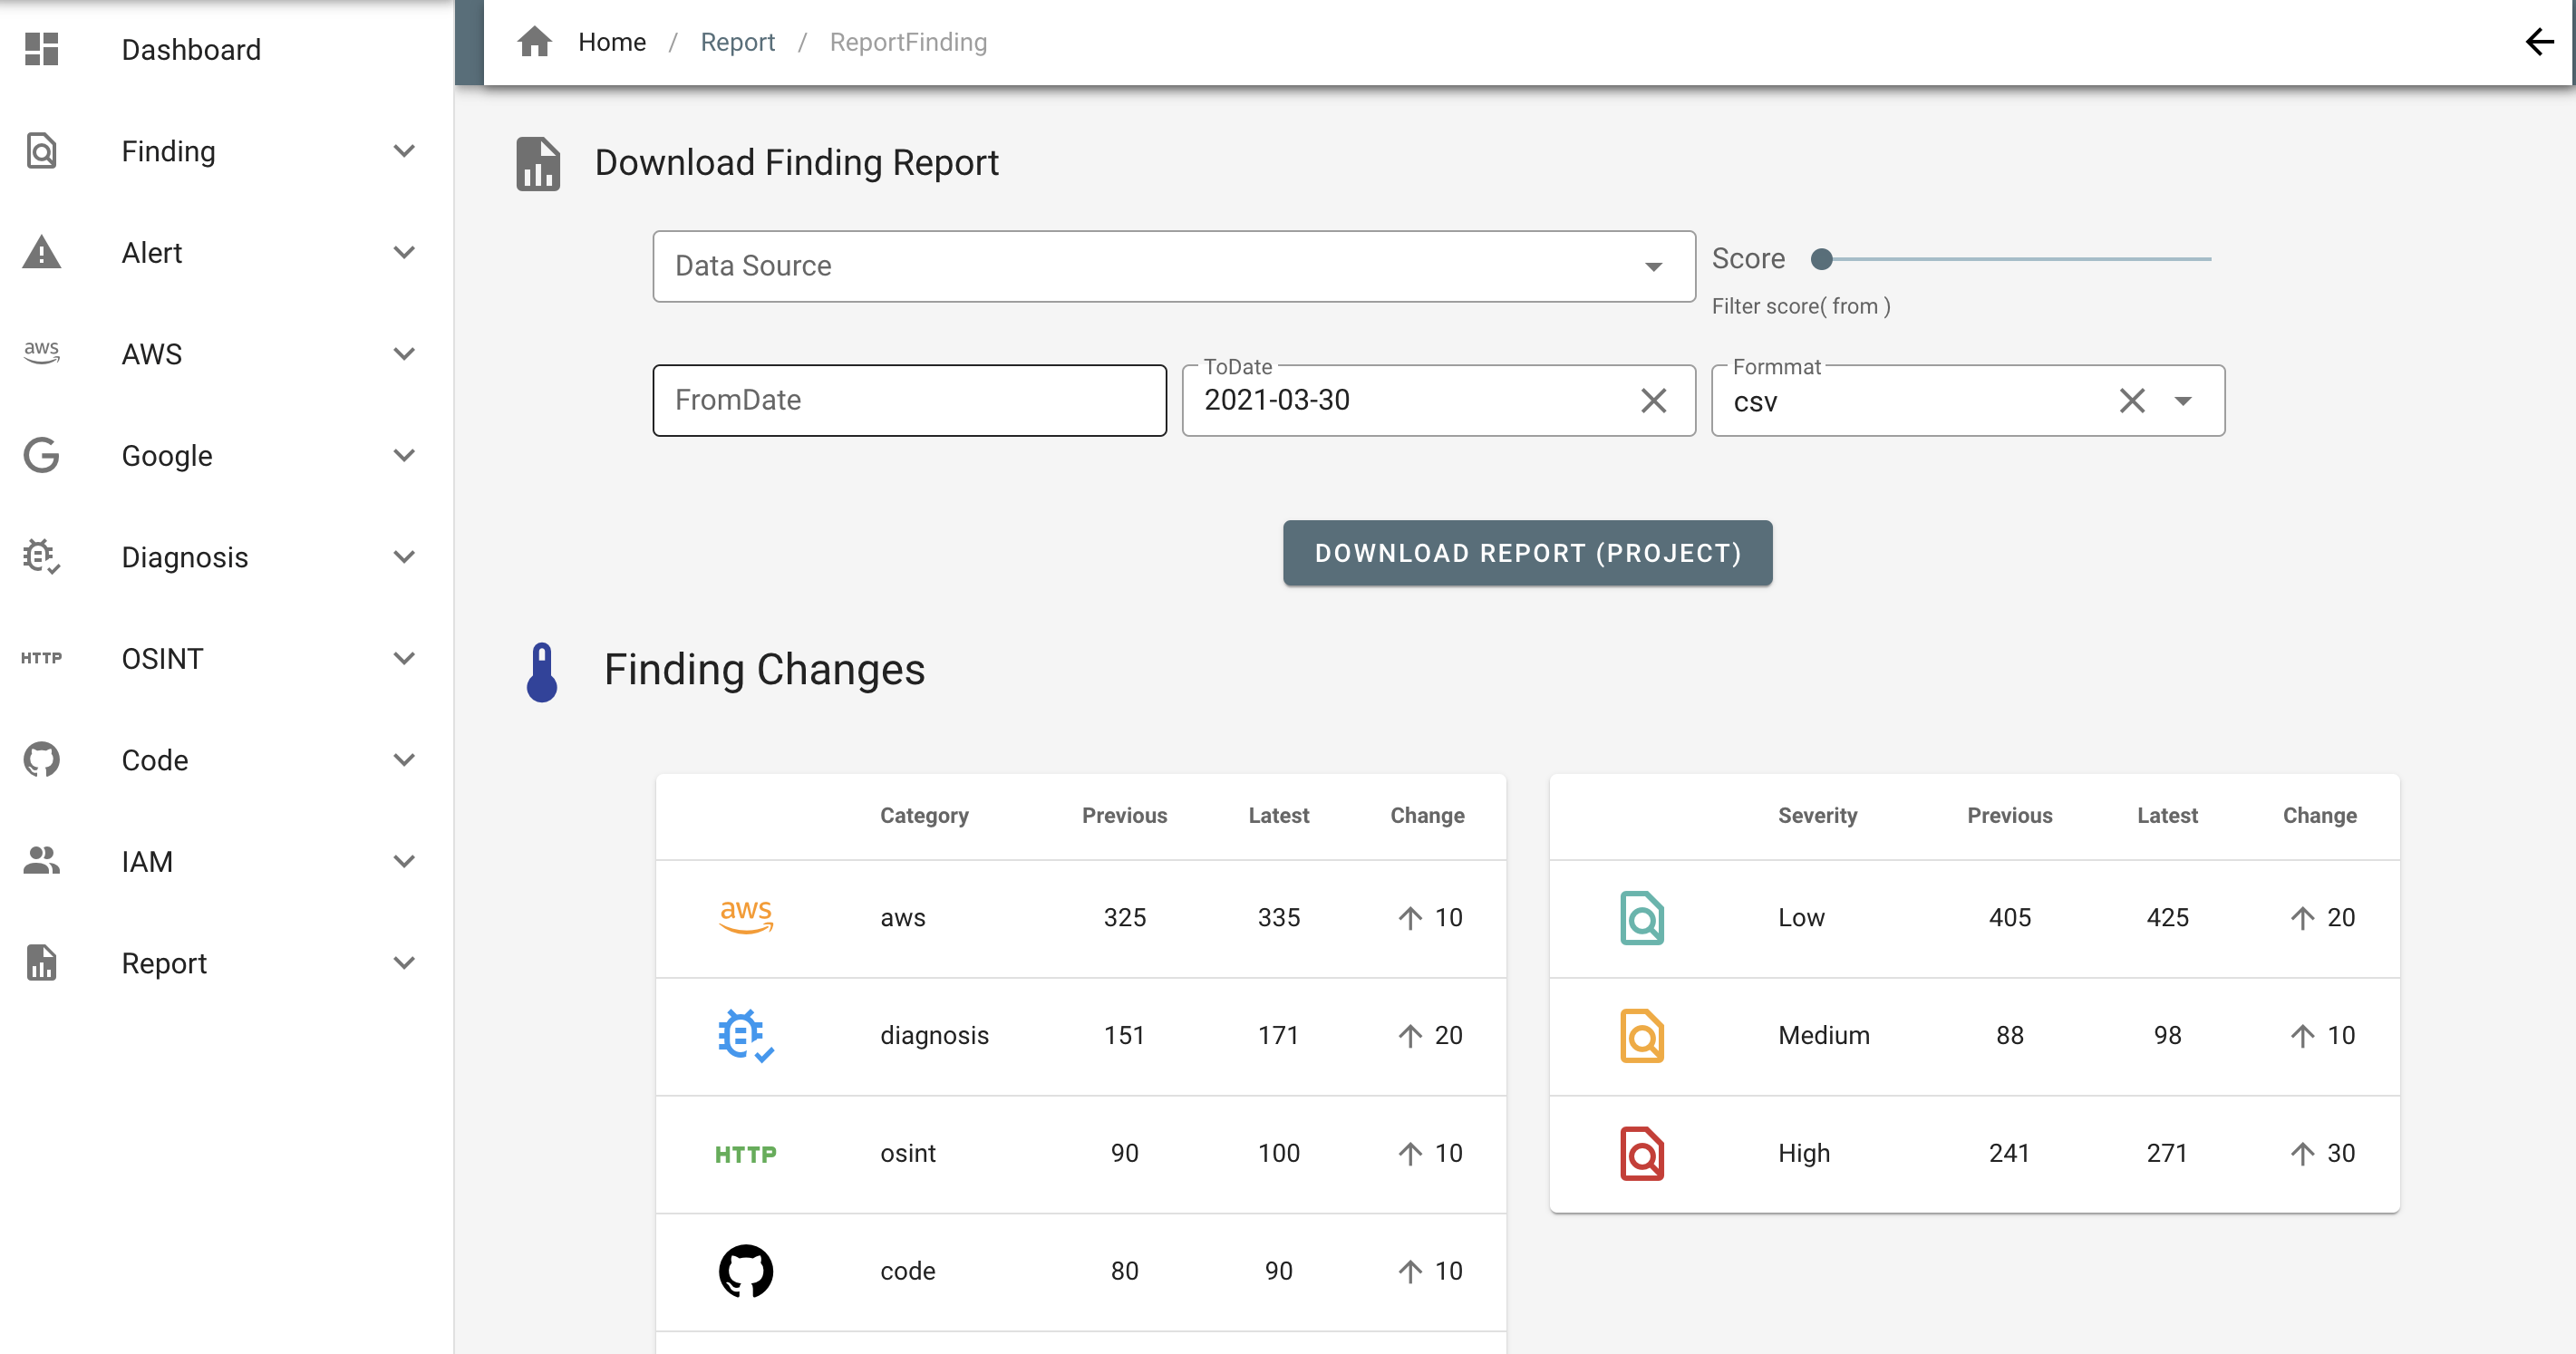
Download
- Go to the
Analysis > Finding Summaryscreen. - Select DataSource, Score, Period, and File format.
- Click DOWNLOAD REPORT(PROJECT) to download statistical data for the currently selected project.
Customization of visualization
To freely customize the visualization of statistical data, it is convenient to use BI tools such as Google Data Studio.